Conky widget · Lua & Cairo
An instrument cluster
for your desktop.
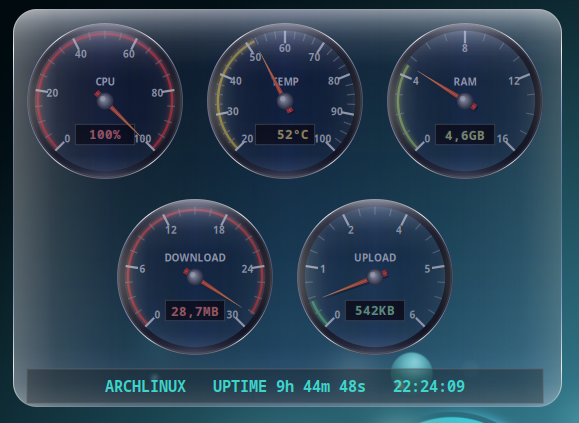
Five backlit analog gauges — CPU, TEMP, RAM, DOWNLOAD, UPLOAD — with damped needles, a self-test sweep, and a liquid-glass lens over every dial. Built for Conky, not a browser tab.
01
Readouts
Needle motion
DAMPED
Spring-eased, not snapped — every reading settles into place instead of jumping.
Power-on
SELF-TEST
A min → max → settle sweep on startup, the way a real cluster wakes up.
Zone backlight
GREEN → RED
The ring behind each dial blends color as the reading nears its redline.
Glass lens
5-LAYER
A round liquid-glass overlay on every gauge, with a face you can make fully transparent.
Ram gauge
AUTO-DETECT
Reads your actual installed memory and scales to 4/8/16/32/64/128/256 GB.
Network gauges
KB ↔ MB
A fixed, speedtest-based MB/s scale, with the LCD switching units automatically.
02
Install
bash
# Clone the repository
git clone https://github.com/wim66/conky-dashboard.git
cd conky-dashboard

# Start the dashboard
conky -c conky.conf
03
Configure
| Setting | What it does |
|---|---|
net_interface | Which interface DOWNLOAD/UPLOAD read from |
net_max_download | DOWNLOAD gauge scale, in MB/s |
net_max_upload | UPLOAD gauge scale, in MB/s |
ram_scale_steps | Clean GB steps the RAM gauge rounds up to |
colors.face_alpha | Dial transparency, 0–1 |
widget.lua
net_interface = "enp0s31f6",
net_max_download = 30, -- MB/s
net_max_upload   = 6,  -- MB/s